

ThoroughCare’s analytics capabilities provide many reports and dashboards that help leaders and their teams manage all aspects of care management, including clinical, financial, and operational performance.
This article will provide an overview of a specific analytics report within ThoroughCare. It helps providers identify missed claim submissions and additional revenue opportunities.
Purpose: Missed Reimbursement Dashboard
The Missed Reimbursement Dashboard reveals missed revenue opportunities that care teams can remediate within the month or improve for the next month’s performance.
This dashboard provides key performance indicators (KPIs) fundamental to the program's financial health and impact on organizational revenue.
The dashboard highlights eight metrics. These are used to meet billing requirements and optimize patient care.
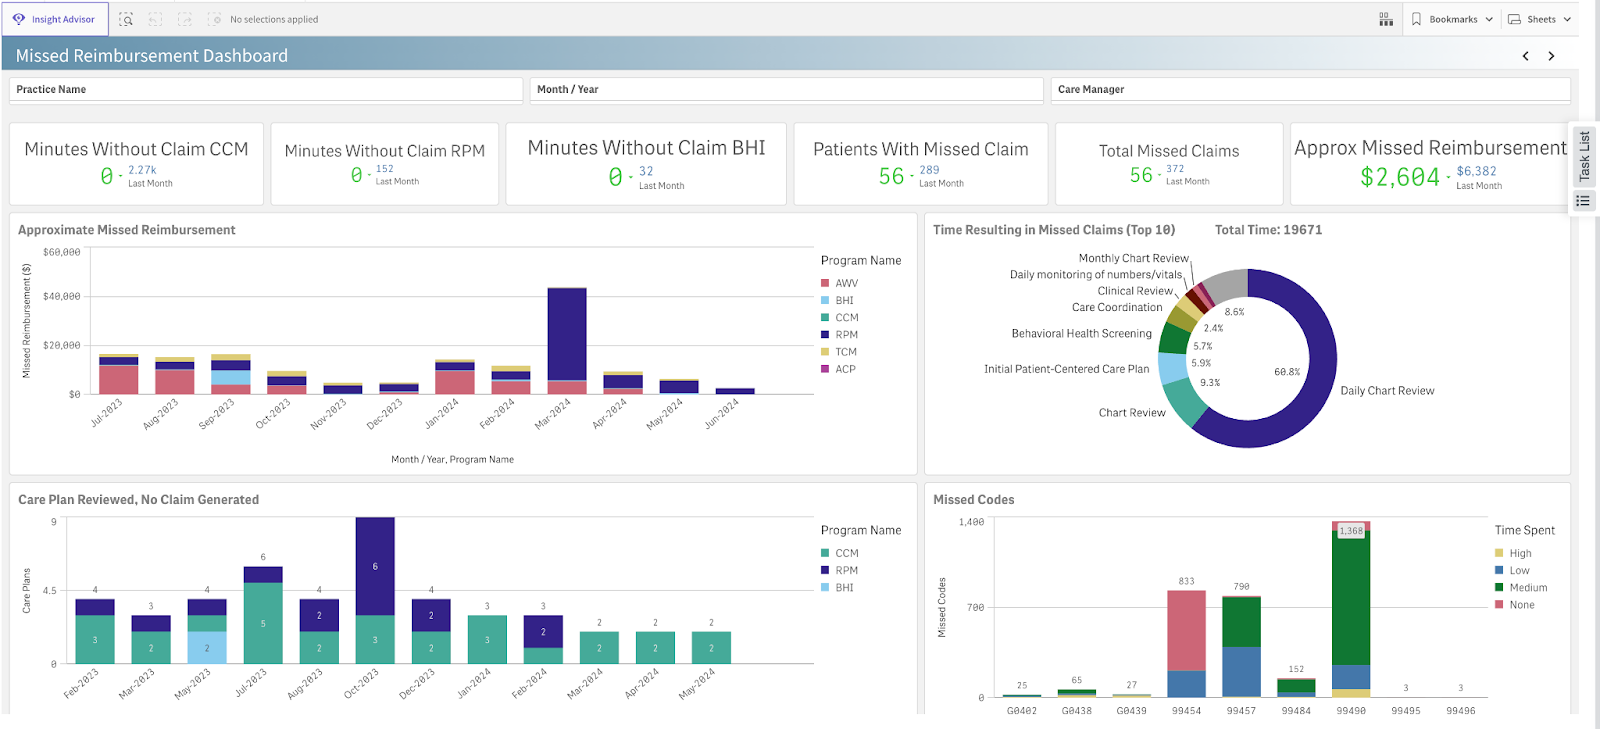
Dashboard Key Performance Indicators
KPI #1: Minutes without claims
These data show the total billable minutes logged (between 0-19) in ThoroughCare that did not result in claims. Across three programs (Chronic Care Management (CCM), Remote Patient Monitoring (RPM), and Behavioral Health Integration (BHI), this metric helps clinicians focus on patients who can meet the billing threshold of 20 minutes.
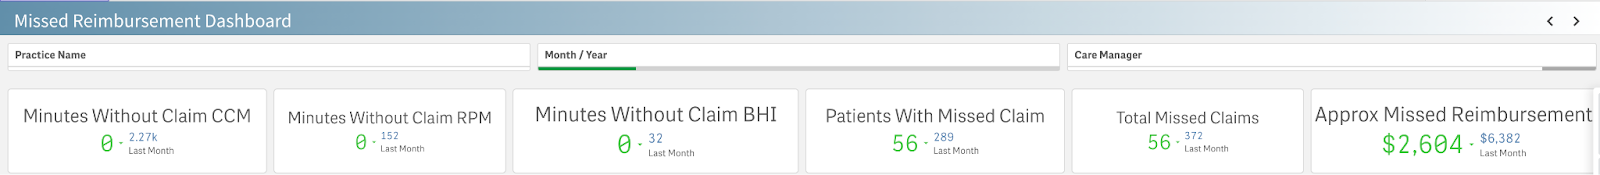
KPI #2: Patients with missed claims
This metric shows the number of patients for whom billable action was or could have been taken, but those actions missed the threshold for a claim. Across CCM, RPM, and BHI, this metric indicates that 0-19 minutes were logged.
For the RPM program, this indicates the number of patients who did not take 16 readings that month or devices that were marked as provider-supplied (code 99453), but never billed.
For Transitional Care Management (TCM), this metric shows the number of patients who started but did not finish the 30-day program.
For Annual Wellness Visits, this metric shows the number of patients who started the AWV process but did not complete it.
All metrics are shown for the current month and the previous month for comparison.
KPI #3: Total missed claims
This data point indicates those claims that could have been billed but were ineligible due to a lack of action or time logged.
KPI #4: Approximate missed reimbursement
Most importantly, this KPI estimates lost revenue by taking the total claims missed and multiplying it by the average reimbursement amount.
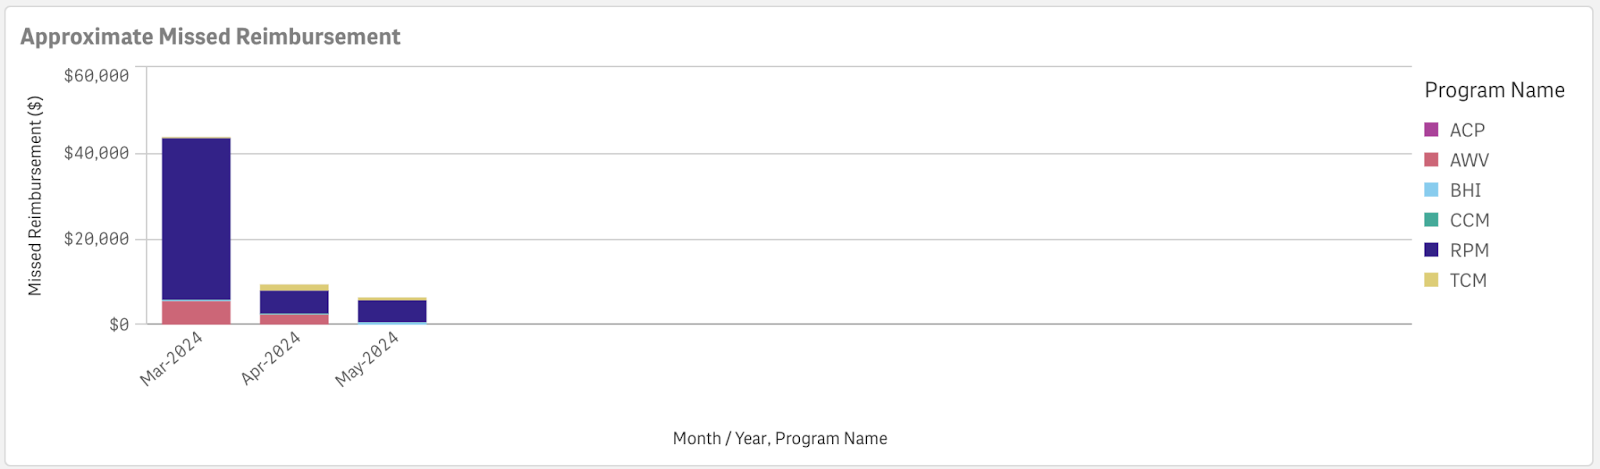
KPI #5: Approximate missed reimbursement graph
This graph displays the dollar amount of claims by program and month that were not billed.
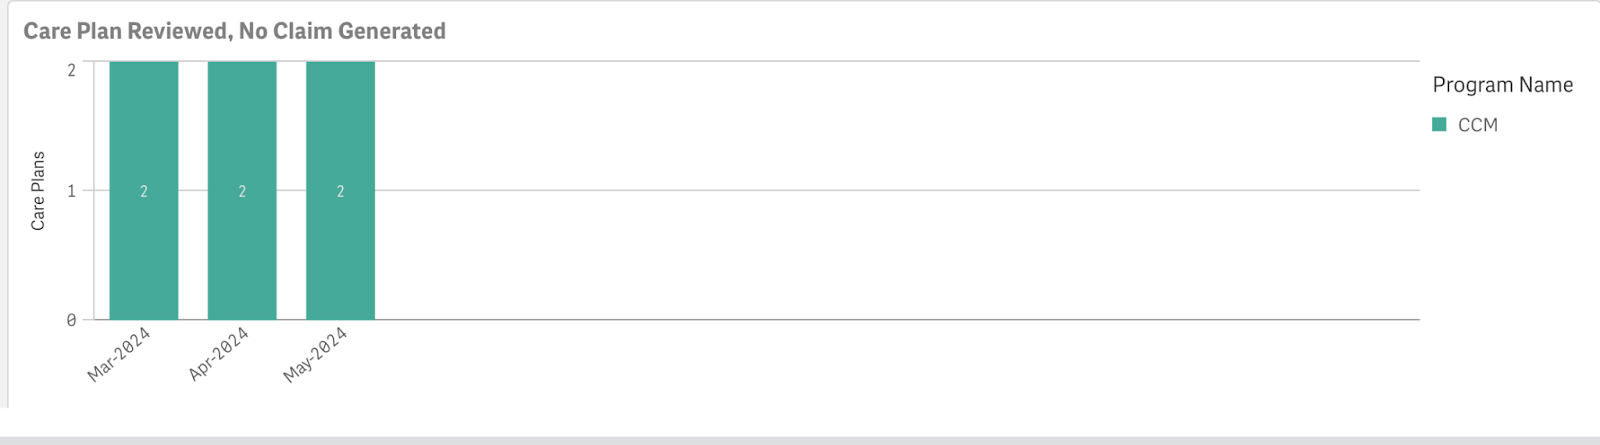
KPI #6: Care plan received, no claim generated
This chart shows the number of care plans by program and month that were marked “received,” but for which no claim was generated.
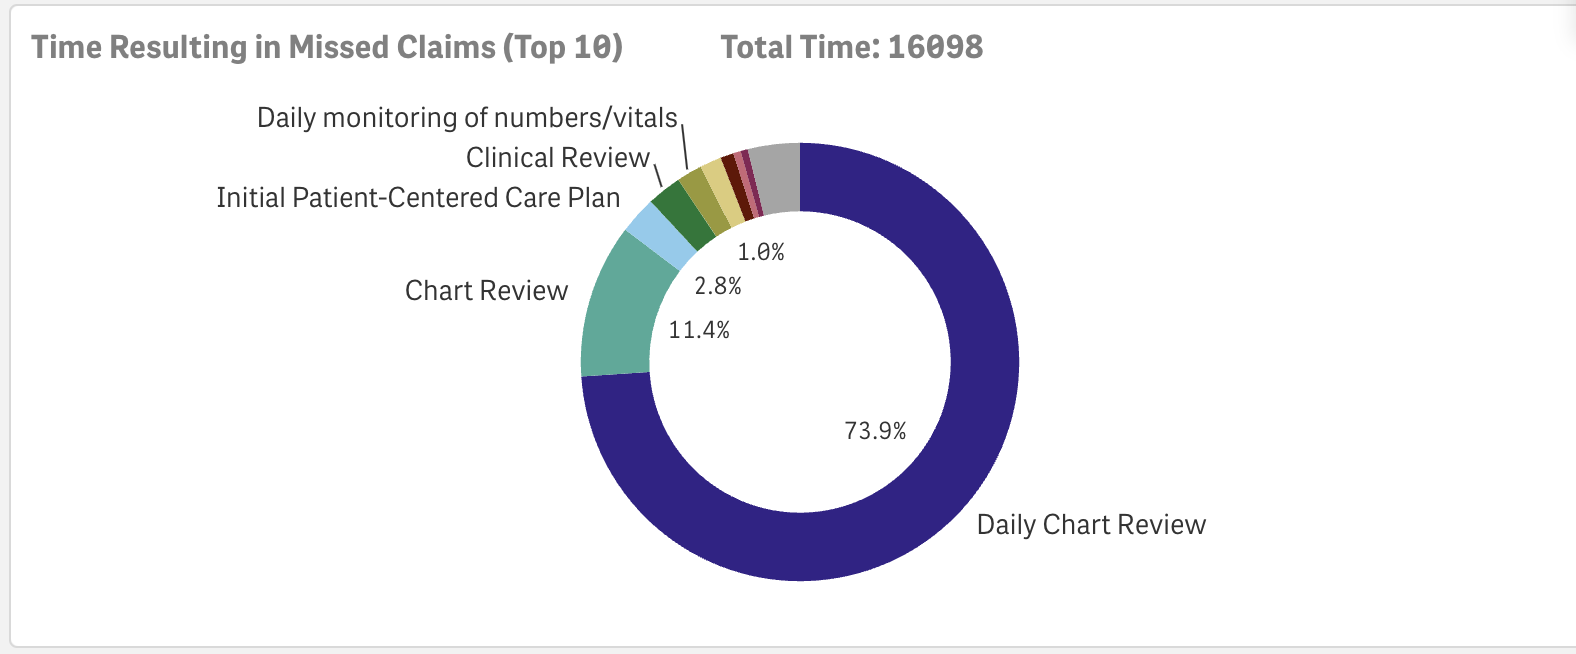
KPI #7: Time resulting in missed claims (top 10)
This graph represents the total accumulated time logged by all care managers but not billed across the top 10 activities. For example, if 10 care managers logged 15 minutes each for clinical review across 10 patients, that would equate to 150 minutes that were logged but not billed.
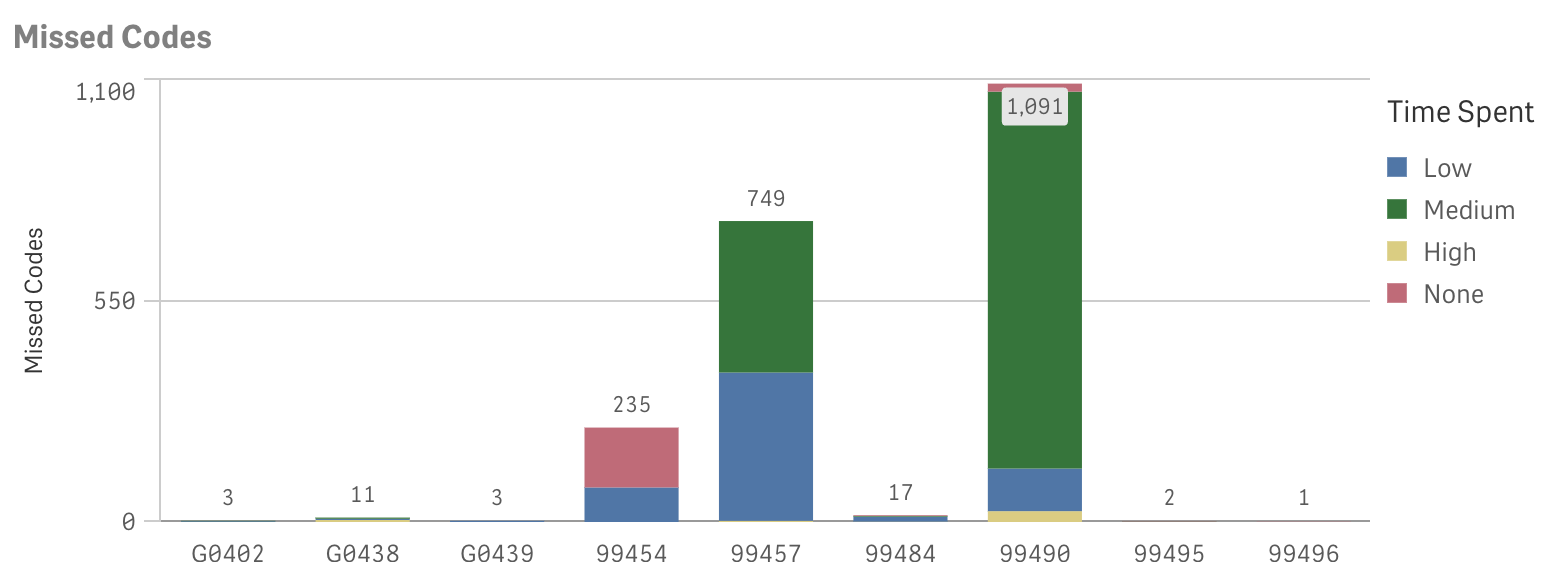
KPI #8: Missed codes
This bar chart shows how much time was contributed to codes that were not billed. Clinicians can determine where their program activities didn’t meet the minimum requirements.
How to use this dashboard
By filtering the dashboard by patient name, month and year, or care manager, the missed reimbursement dashboard is a handy tool for clinicians to see how well they meet monthly minimum billing requirements.
For financial and operational leaders, the dashboard highlights missed revenue opportunities and performance indicators. This data can help prioritize areas where efficiency and quality can be improved.
ThoroughCare enables complete data-driven oversight and improvement of care management programs
ThoroughCare’s reporting and analytics capabilities provide KPIs needed for robust oversight, compliance, and management of care programs.
The easy-to-use reports and dashboards also support quality and performance improvement, ensuring a program meets its care delivery and patient goals.